Automatic :-  -
-  Signals with: -
  -
- 
Advanced Alert feature  -
-  window
Just Call for Free Live Demo
09762793066 | 09762753066
EasyLiveTrade - The Best Technical Analysis Charting Software with Auto Buy Sell Signals

Features
MOBILE FRIENDLY
We are providing mobile friendly technical chart with auto buy sell signal.
ALERTS
Technical software gives sound alerts and pop up box. Pop up box shows buy sell signals with Target & Stop loss.
ACCURACY
We intraday software provides 85-90% accuracy in NSE, MCX & Currency.
Real Time Data
All stock future & option, NSE, MCX & Currency. 3 months contract. Tick data from authorized exchange vendor.
Welcome to www.easylivetrade.com
We provide Technical analysis chart software for Indian Shares Market NSE futures and options, MCX (Commodities) and Currency Market. With EasyLiveTrade everyone can become professional trader, and earn good Profit. Live Technical charts give Automatic Buy Sell Signals with Target and Stop-Loss. Also gives advanced features like sound alert, pop-up Windows and scanner. After long research EasyLiveTrade provides 1 or 2 signals per day for best intraday trading calls with 85% to 90% accuracy.
The Intraday trading software is the complete day trading strategy system. Technical analysis is not limited to charting, but it always considers price trends up, down sideways direction for profitable perfect intraday trading, day trading & delivery trading - positional trading. Auto buy sell signal software developed by experience technical expert.
The software is very easy to understand for right time entry and exit. Our technical chart formula shows target and stop loss ratio is 2:1 which means stoploss will be half price of target.
For Example: if you bought shares @ 100, Target =102, Stop Loss = 99
Mobile Live technical chart
We are first who developed mobile application in India for technical analysis charts in June 2013. It works on all type of smart phone. Our mobile login is free when you purchase our technical analysis software for computer. It is not possible to seat in front of your computer all the time so to be connected with the market and know every moment use our user friendly EASY MOBILE VERSION APPLICATION.
In mobile we are providing 10 mins timeframe. You can watch nifty live chart and bank nifty live technical chart and nifty 50 shares in NSE. In commodity market you can see all commodity live technical charts with auto buy sell signal. All currency market also you can see. In mobile option live technical chart are not show, only in computer call put option chart work.
 |
System RequirementLaptop / Desktop / Tablet PCProcessor: 1.2GHz or higher RAM: 1GB (2 GB recommended) Hard Disk space: 1 GB minimum Display resolution: Minimum 800 * 600 Resolution Operating System: Windows XP, Windows Vista Etc Windows 7, Windows 8, Windows 8.1, |
|
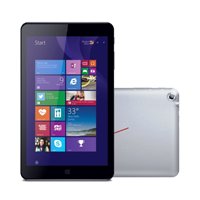
Recommended Tablet PC iBall Slide WQ32 1.83Ghz, 16GB Memory, 2GB RAM, WiFi, 3G SIM) with Windows 8 Approx Price RS.- 8000/- iBall Slide i701(1.83Ghz, 16GB Memory, 1GB RAM, WiFi, 3G via Dongle) with Windows 8 Approx Price RS.- 5000/- |
|
Little Changes that’ll make a Big Difference with Your Trading
| Technical Analysis Software | Tips | |
|---|---|---|
| Decision Making | You know which tools or calculations are used in your decision making. | You don’t know which tool or calculation tip person is using or he is just giving his personal suggestion or he might have individually bought some shares so he is telling you to buy the same, he may be wrong with it. |
| Timing | You get recommendations in live market or prior. | By the time tips provider sends you sms you receive it then you put the order you may loose correct entry. |
| Trailing stoploss | You get proper stoploss & trailing stoploss time to time. | Mostly only 1 stoploss & 1 target, if provides trailing stoploss needs to depend on him. |
| Historical study | You can see previous history and levels of stock on the graph. | You don’t know any levels, only depends on tips providers study. |
| Costing | One time & less cost | Comparatively high cost, paying again & again for different packages. |
| Dependency | No dependency whenever you are free you can open software and see current market situation. | Need to depend on tips provider’s SMS, you may be busy or might not see the SMS. |
Technical Analysis Vs Fundamental Analysis.
For decades, fundamental analysis was the only investment method that was given any credibility.
That has changed as the advent of high-speed computing has made technical analysis easier and more widely available.
Many large investment companies use computerized system to determine their entry and exit points.
That means that many of the largest market players are taking their trading decisions based on computer algorithms.
In fact, some estimate that computerized trading represents up to 75% of the volume on exchanges today.
Like it or not, your investments are moving based on technical factors as much as fundamental ones.
The markets have changed, and we need to change our strategies with them.
The best approach of investing likely involves some combination of fundamental and technical analysis.
I like to choose stocks or sectors that have strong fundamentals and then use technical analysis to help me decide when to buy or sell them.

| Right Study | Right Tools | Right Time |
 |
 |
 |
Customer Support
Experienced Staff for support in multi languages- English, Hindi, Marathi, Telgu, Tamil, Malayalam, Kanada & Gujarati.
Technical Experts mobile numbers. Direct contact & immediate solution in simple & understandable terms in On & Offline market.
Each & every query will be handled on high priority.
Tick by tick live market price. Live Technical chart such as Nifty Future, NSE and MCX
The techniques in this software are unique and easy to learn & use. So don't waste time and money in buying tips blindly when you can understand the market, make profit by yourself. So this software is your right guidance at the right time.
No need of studying any difficult Indicators like RSI, MACD, STOCHASTICS, Confusing Averages like Simple Moving Average, Exponential Moving Average or Bands like Bollinger Bands, Keltner Bands, Oscillators like Price Oscillator, Ultimate Oscillator(It is boring to read just think how tuff it is to study)- We are not here to do study, give exam & get marks, we just want profit.
Automatically search better opportunities in all scripts. All best Technical signals will come only after getting confirmation in Technical Indicators, Historical Price, Averages, Bands, Pivot Levels, Resistance & Support Levels Volume & most important it shows Up/Down Trends ( Trend is our Friend)
Software is useful for Individual Traders, Brokers, Sub-brokers, Advisory companies & Tips providers.
The trade view includes Intraday Trading and Delivery for Short term and Long term trading. Intraday live Technical Chart plus EOD from 2005


